


Macroeconomic Comparison: Argentina vs. United States
This project compares Argentina and the United States using real economic data from FRED, the World Bank, IMF, and other sources. The analysis explores GDP, inflation, unemployment, banking, trade and overall economic performance.
Explore the comparison
This website compares Argentina and the United States using real economic data. Explore each section to learn about GDP, inflation, unemployment, banking, international trade, and the major strengths and challenges of both economies.

Introduction to Argentina
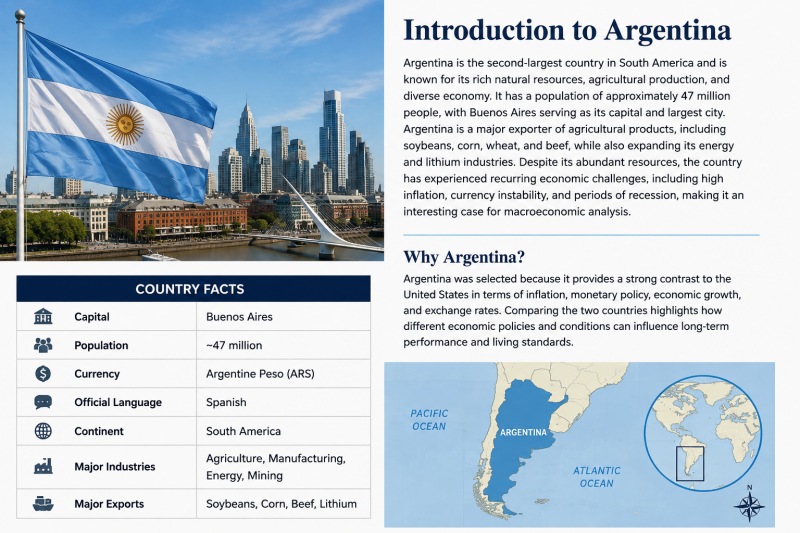
Learn about Argentina's location, population, currency, major industries, exports, and the reasons it was selected for this macroeconomic comparison

GDP and Economic Growth
Compare real GDP, real GDP per capita, and long term economic growth in Argentina and the United States.

Inflation and Labor Markets
Examine inflation, unemployment, and labor market conditions to understand how prices and employment have changed in both countries.

Banking and International Trade
Explore central banking, interest rates, exports, import, exchange rates, and Argentina's major trading relationships.
Introduction to Argentina
An overview of Argentina's geography, economy, and the reasons it was selected for this macroeconomic comparison
GDP and Economic Growth

Figure 1. Real GDP of Argentina and the United States (2000–2023). Source: FRED, Penn World Table 11.0.
This graph compares the inflation-adjusted size of Argentina’s economy with that of the United States from 2000 through 2023. Both series are measured in millions of 2021 U.S. dollars, which makes the values directly comparable. The graph shows that the United States has a much larger economy and experienced stronger overall growth during this period. Argentina’s real GDP increased during several years, especially following its early-2000s economic crisis, but its progress was less consistent. Its economy experienced repeated periods of stagnation or decline, including recessions before the COVID-19 pandemic and a sharp contraction in 2020. Both countries recovered after the pandemic, but the United States remained substantially larger and followed a steadier long-term growth path. This comparison measures total economic output, not the average living standard of each resident.
Real GDP Per Capita
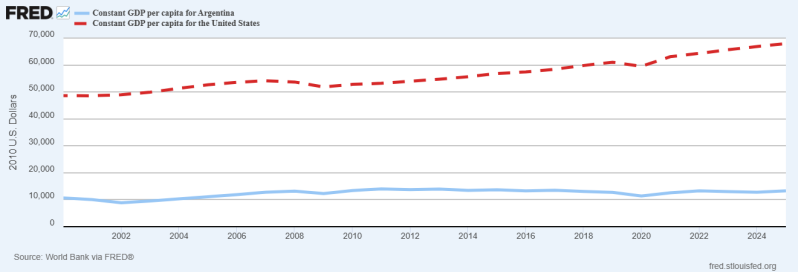
Figure 2. Real GDP per Capita of Argentina and the United States (2000–2024). Source: World Bank via FRED.
This graph compares real GDP per capita in Argentina and the United States from 2000 to 2024. Real GDP per capita measures the average economic output produced per person and is commonly used as an indicator of living standards. Throughout the period, the United States maintained a much higher GDP per capita than Argentina, reflecting greater average income and productivity. Argentina experienced periods of economic growth, but progress was interrupted by recurring recessions, inflation, and financial instability. Both countries experienced a decline during the COVID-19 pandemic in 2020, followed by a recovery. Overall, the graph shows that while Argentina's economy has grown over time, the average standard of living has remained well below that of the United States.
Indexed Real GDP per Capita (2000 = 100)
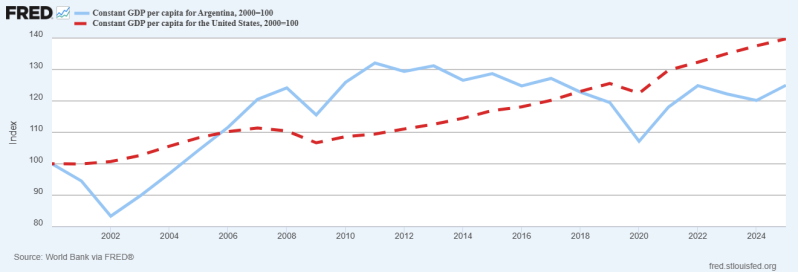
Figure 3. Indexed Real GDP per Capita of Argentina and the United States (2000 = 100). Source: World Bank via FRED.
This indexed graph compares the growth of real GDP per capita in Argentina and the United States after setting both countries equal to 100 in the year 2000. Indexing removes the large difference in income levels and focuses only on how much each country's economy grew over time. The United States experienced relatively steady growth throughout the period with only temporary declines during the 2008 financial crisis and the COVID-19 pandemic. Argentina showed more volatile growth, with periods of expansion followed by declines caused by recurring inflation, financial instability, and economic recessions. Overall, the graph highlights that the United States achieved more stable long-term growth while Argentina experienced greater economic fluctuations.
Inflation
Consumer Price Index (CPI)
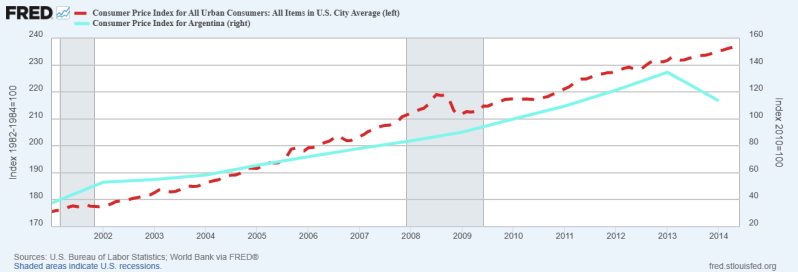
Figure 4. Consumer Price Index (CPI) for Argentina and the United States (2001–2014). Sources: U.S. Bureau of Labor Statistics and World Bank via FRED.
Note: Argentina's CPI data in FRED are available only through 2014 for this series. The comparison uses the longest period with consistent data for both countries.
This graph compares the Consumer Price Index (CPI) for Argentina and the United States from 2001 to 2014. The CPI measures the average level of prices paid by consumers for goods and services over time. During this period, prices increased in both countries, but Argentina experienced much faster growth in its price index than the United States. The U.S. showed a gradual and relatively stable increase in prices, reflecting generally low inflation. Argentina's CPI increased more rapidly, indicating stronger inflationary pressures throughout much of the period. Although both countries experienced rising prices, Argentina's higher rate of increase demonstrates that inflation had a much greater impact on consumers and the overall economy.
Inflation Rate: Argentina vs. United States (2000–2024)
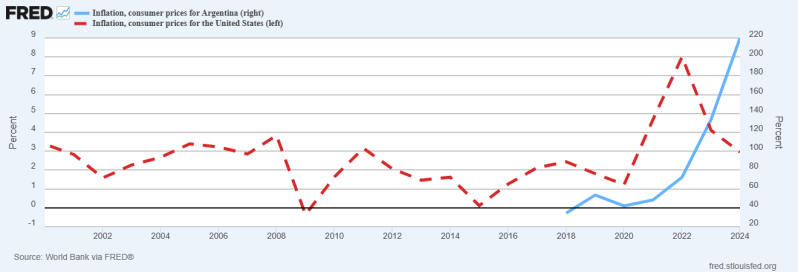
Figure 5. Annual inflation rate for Argentina and the United States (2000–2024). Source: World Bank via FRED.
This graph compares the annual inflation rates of Argentina and the United States from 2000 through 2024. Unlike the Consumer Price Index, which shows the overall level of prices, the inflation rate measures how quickly prices change from one year to the next. Throughout most of the period, the United States experienced relatively low and stable inflation, generally remaining below 5 percent except during the post-pandemic inflation surge in 2022. Argentina experienced much higher and more volatile inflation, with inflation accelerating rapidly after 2021 and exceeding 200 percent by 2024. These results highlight the significant differences in economic stability between the two countries. While both countries faced inflationary pressures, Argentina experienced persistent and severe inflation that had a much greater impact on consumers, businesses, and overall economic conditions.
Unemployment and Labor Markets
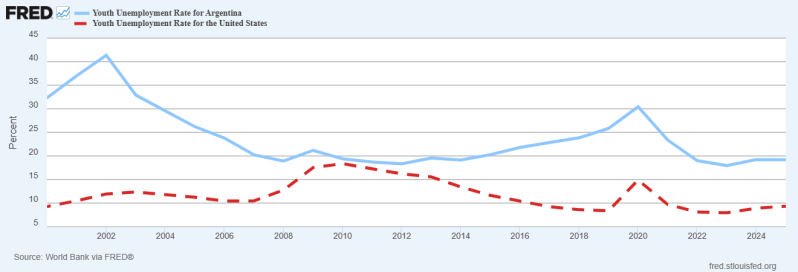
Figure 6. Youth unemployment rate in Argentina and the United States (2000–2025). Source: World Bank via FRED.
Youth unemployment measures the percentage of people ages 15–24 who are actively looking for work but cannot find a job. The graph shows that Argentina has consistently experienced much higher youth unemployment than the United States throughout the period. Argentina began the early 2000s with unemployment above 30%, gradually improving before rising again around the COVID-19 pandemic in 2020. Although conditions have improved since then, unemployment remains significantly higher than in the United States. In contrast, the United States generally maintained youth unemployment below 15%, with only a temporary spike during the pandemic before returning to lower levels. This comparison suggests that Argentina's labor market has faced greater challenges in creating stable employment opportunities for young workers, while the U.S. labor market has remained relatively stronger and more resilient.
Real Exports of Goods and Services
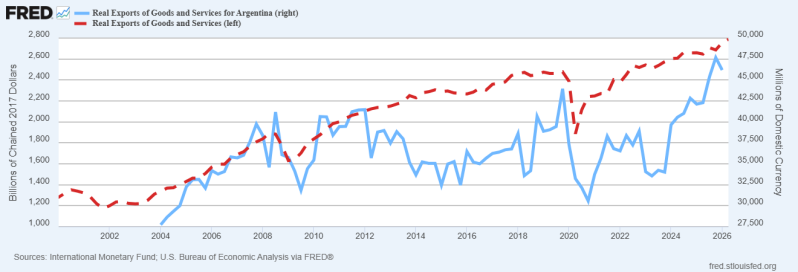
Figure 7. Real exports of goods and services for Argentina and the United States (2000–2025). Source: IMF and U.S. Bureau of Economic Analysis via FRED.
This graph compares the trend in real exports of goods and services for Argentina and the United States from 2000 through 2025. Although the two series use different measurement units and cannot be directly compared by value, they show how exports changed over time within each country. The United States experienced relatively steady export growth, with a noticeable decline during the COVID-19 pandemic in 2020 before recovering and reaching new highs. Argentina's exports were much more volatile, showing larger fluctuations throughout the period and a sharp recovery in recent years. These differences reflect the greater stability of the U.S. economy and the greater sensitivity of Argentina's economy to domestic economic conditions, exchange rate movements, and global commodity markets. Exports remain an important source of economic growth for both countries.
Domestic Credit to Private Sector (% of GDP)
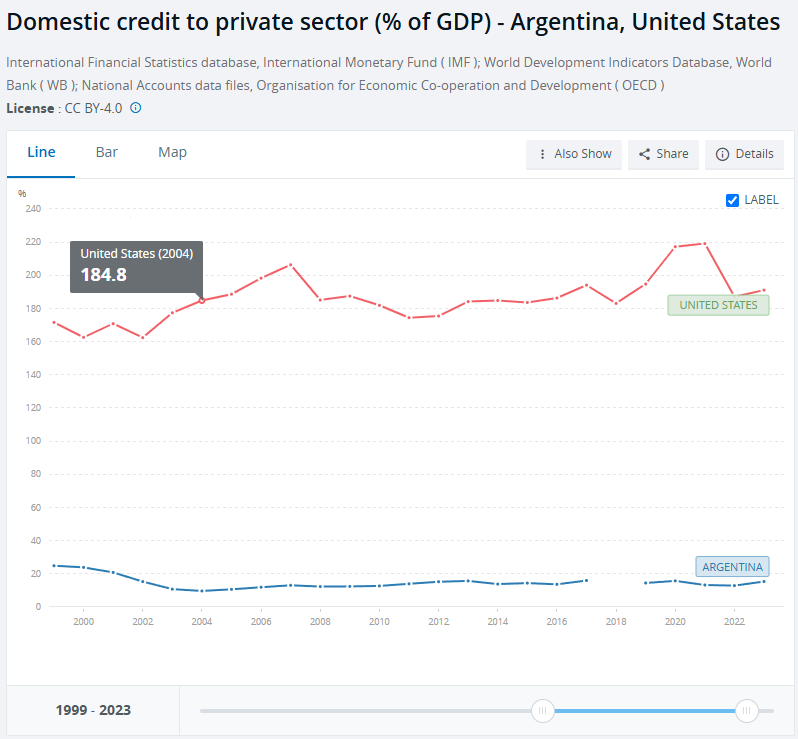
Figure 8. Domestic Credit to the Private Sector (% of GDP): Argentina vs. United States (1999–2023). Source: World Bank.
Category
Currency
Central Bank
Monetary Policy Goal
Currency Type
Argentina
Argentine Peso (ARS)
Central Bank of the Argentine Republic (BCRA)
Control inflation and stabilize the peso
Floating exchange rate
United States
U.S. Dollar (USD)
Federal Reserve System
Maintain stable prices and maximum employment
Floating exchange rate
Domestic credit to the private sector measures how much banks and financial institutions lend to businesses and households relative to the size of the economy. The graph shows that the United States consistently has a much higher level of private credit than Argentina. Throughout the period, U.S. lending remained around 170–220% of GDP, while Argentina generally stayed below 25% of GDP. This large difference reflects the stability and depth of the U.S. financial system, where businesses and consumers have greater access to loans and credit. Argentina's lower level of private credit is influenced by high inflation, economic instability, and frequent changes in monetary policy, which discourage long-term lending. A stronger banking sector supports investment, business expansion, and consumer spending, making domestic credit an important indicator of economic development and financial health.
International Trade and Finance
Country Overview
Largest Exports
Largest Imports
Largest Trading Partners
Currency
Exchange Rate
Soybeans, Corn, Beef, Lithium
Machinery, Vehicles, Chemicals
Brazil, China, United States
Argentine Peso (ARS)
Floating (managed by the BCRA)
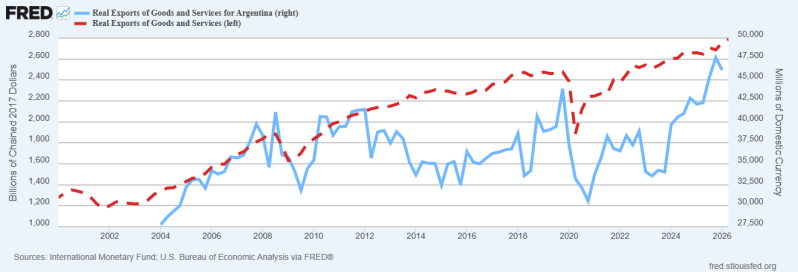
Figure 7. Real Exports of Goods and Services: Argentina vs. United States (2000–2025). Source: International Monetary Fund and U.S. Bureau of Economic Analysis via FRED.
This graph compares the value of real exports of goods and services between Argentina and the United States. The United States exports substantially more goods and services than Argentina due to the larger size and greater diversification of its economy. Argentina's exports fluctuate more over time because they rely heavily on agricultural products and commodities, whose prices and production can vary because of weather conditions and global demand. The United States experienced a noticeable decline during the COVID-19 pandemic in 2020 but recovered quickly afterward. Argentina also experienced fluctuations but showed strong export growth in recent years. Export performance is an important indicator because international trade supports economic growth, creates jobs, and generates foreign currency needed to pay for imports and stabilize the economy.
Exchange Rate
Argentine Peso - US Dollar
The Argentine peso has experienced significant depreciation over time compared with the US dollar
Conclusion
Throughout this project, I learned how differently two countries can perform economically even though both participate in the global economy. Comparing Argentina with the United States showed how inflation, GDP growth, unemployment, banking systems, and international trade all influence a country's overall economic performance. Argentina has experienced high inflation, periods of economic instability, and limited access to private credit, while the United States has maintained a more stable economy with stronger financial institutions and lower inflation over the long term. I also learned that no single graph tells the entire story, specially since some graphs were unavailable. Looking at several economic indicators together provides a much better understanding of a country's strengths, weaknesses, and long term economic trends. Overall, this comparison demonstrated how government policies, monetary decisions, and global trade can significantly affect economic growth and the standard of living.
As someone originally from Argentina, I found this project especially interesting because it helped me better understand the economic challenges my country has faced over the years. Comparing Argentina with the United States showed me how inflation, banking policies, and economic stability can affect everyday life. It also gave me a greater appreciation for how different economic systems influence opportunities for businesses and individuals.
Sources
Federal Reserve Economic Data (FRED)
World Bank
International Monetary Fund (IMF)
Atlas of Economic Complexity
Central Bank of the Argentine Republic (BCRA)
US Bureau of labor Statistics
Create Your Own Website With Webador